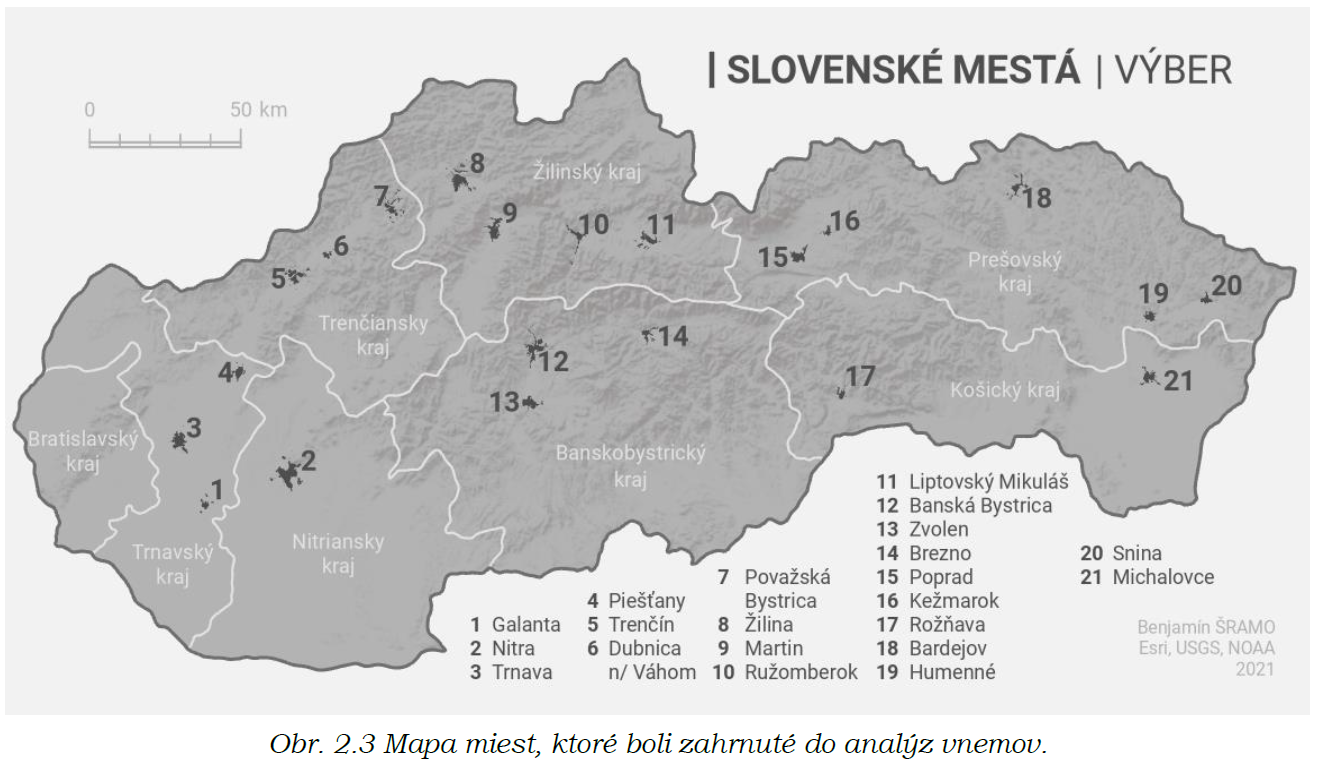
Map od the selected towns for analyses in Slovakia.
There are 21 in total, evenly distributed across the Slovakia.

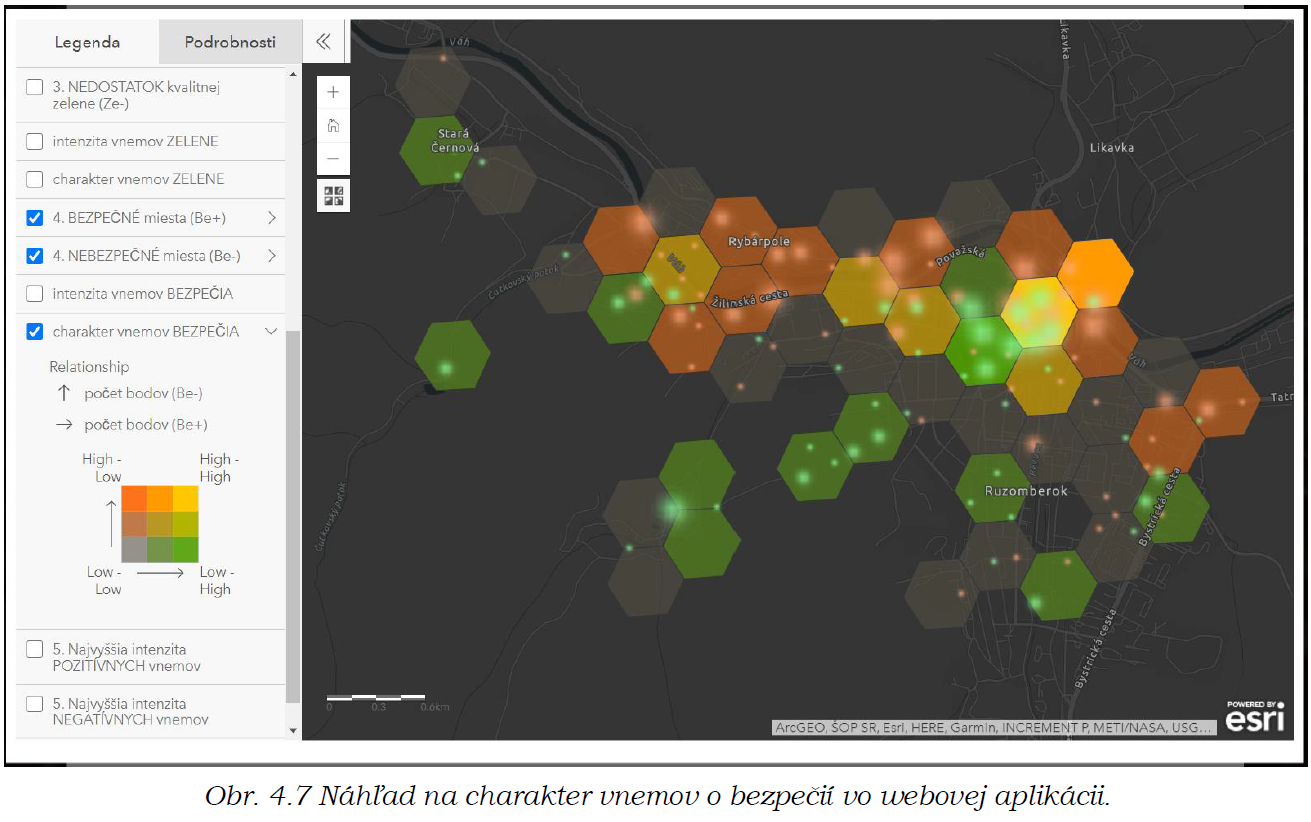
The thesis aimed to evaluate 21 Slovak towns based on citizen perception data from the perspective of geoinformatics. The secondary task was to involve suitable data sources, such as OpenStreetMap, to partake in the analyzes or to assist in the interpretation of the results. Four methods of spatial visualization offered an insight into the data from four different perspectives. Each method brings its exceptional part to the "puzzle" of understanding the spatial distribution of phenomena.
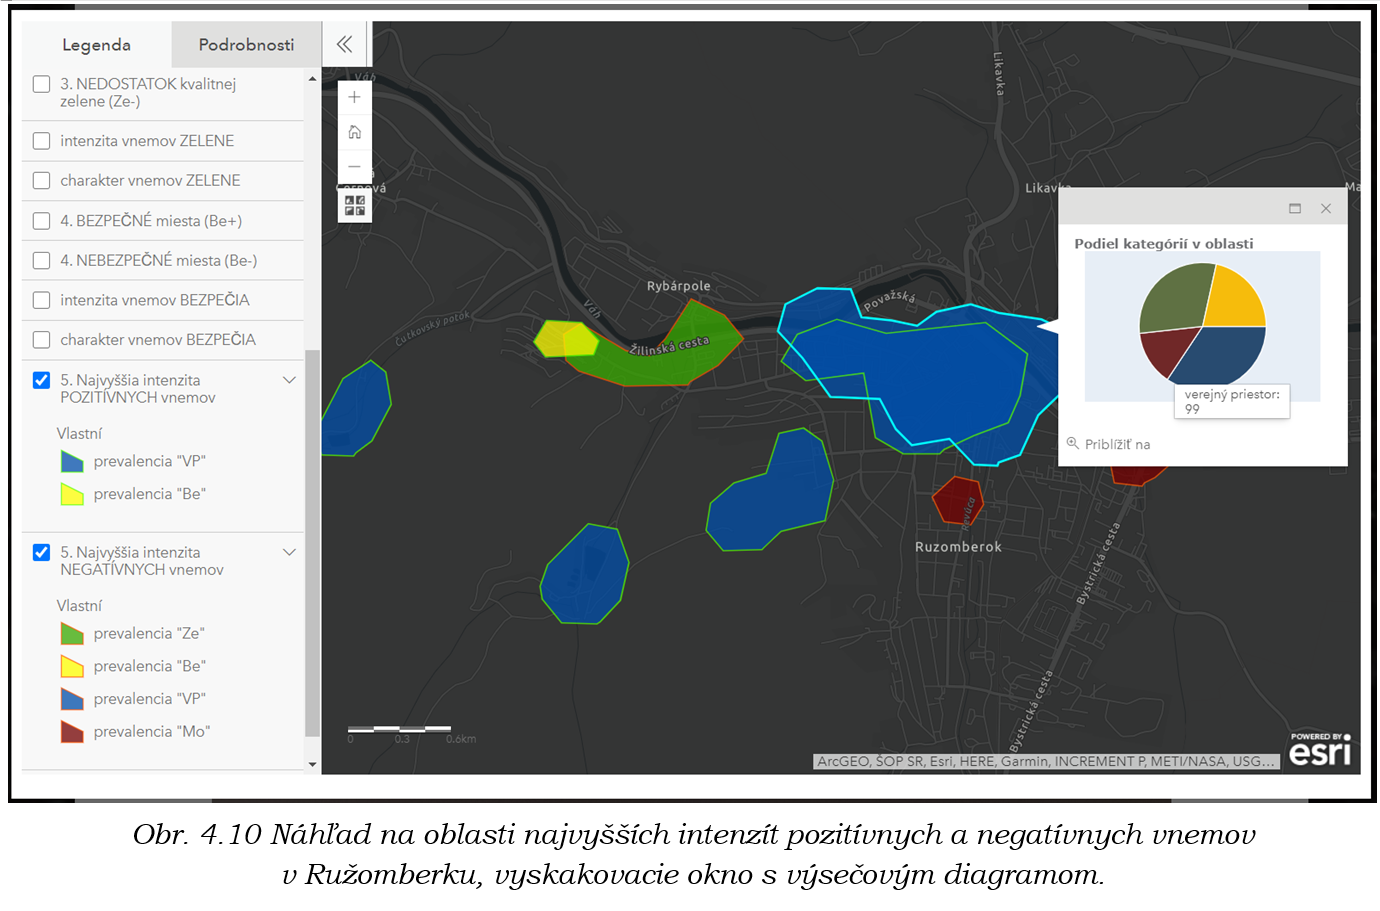
The results of this work are also tables of summary statistics. There are applied three statistical methods, which also worked with various data sources. Calculations were focused on the occurrence of perceptions in typical localities and the degree of clustering of the points, lastly, own quality of life indices were purposed. These results allow the comparison of results in groups of similar places. A more detailed interpretation of the results was given in the case study of the town of Ružomberok. It analyzed the answers of citizens in more detail. Based on the identified clusters, the characteristics of the answers and other results, the author interpreted the factors for the occurrence of the recorded perceptions in space.
Finally, a discussion was held with experts on participation and urbanism in Ružomberok. The debate assessed the potential of implying the results of the participatory project or other similar projects in the future.
There are 21 in total, evenly distributed across the Slovakia.
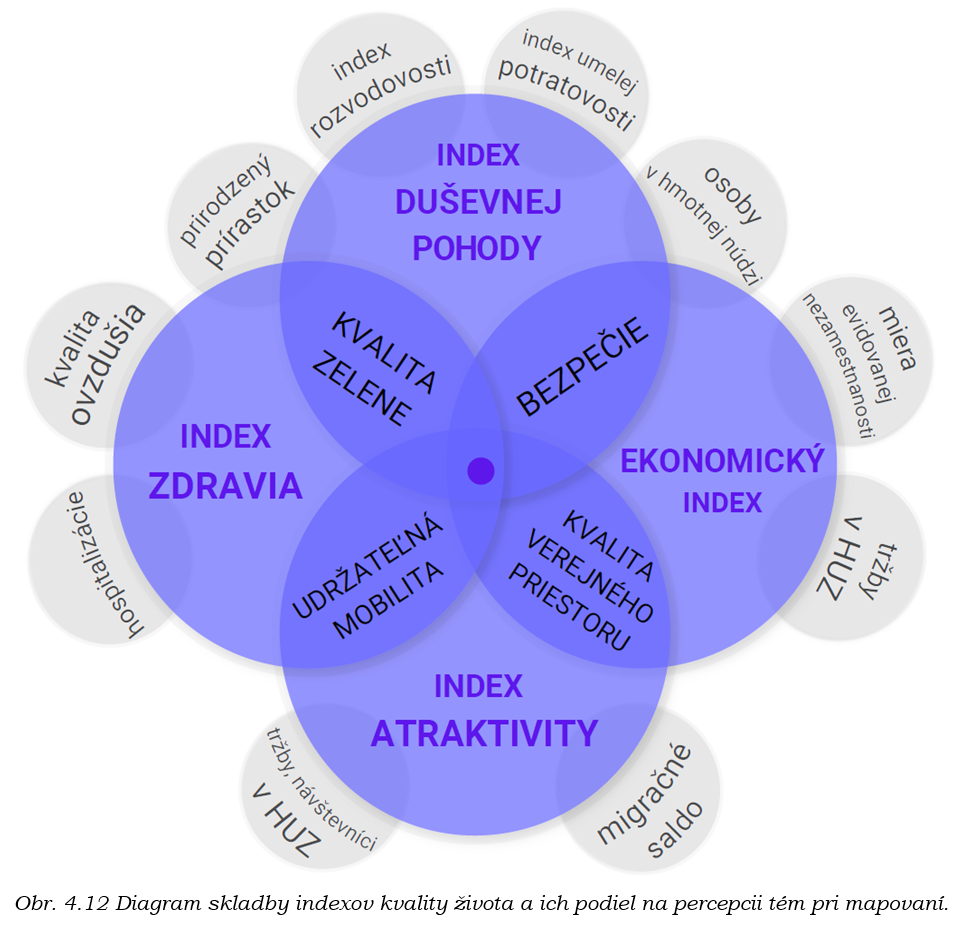
They deal with the mental well-being, physical health, economic prosperity and attractiveness of each town.
Based on Kernel Density upper quintile; the densiest 20% of the studied area.
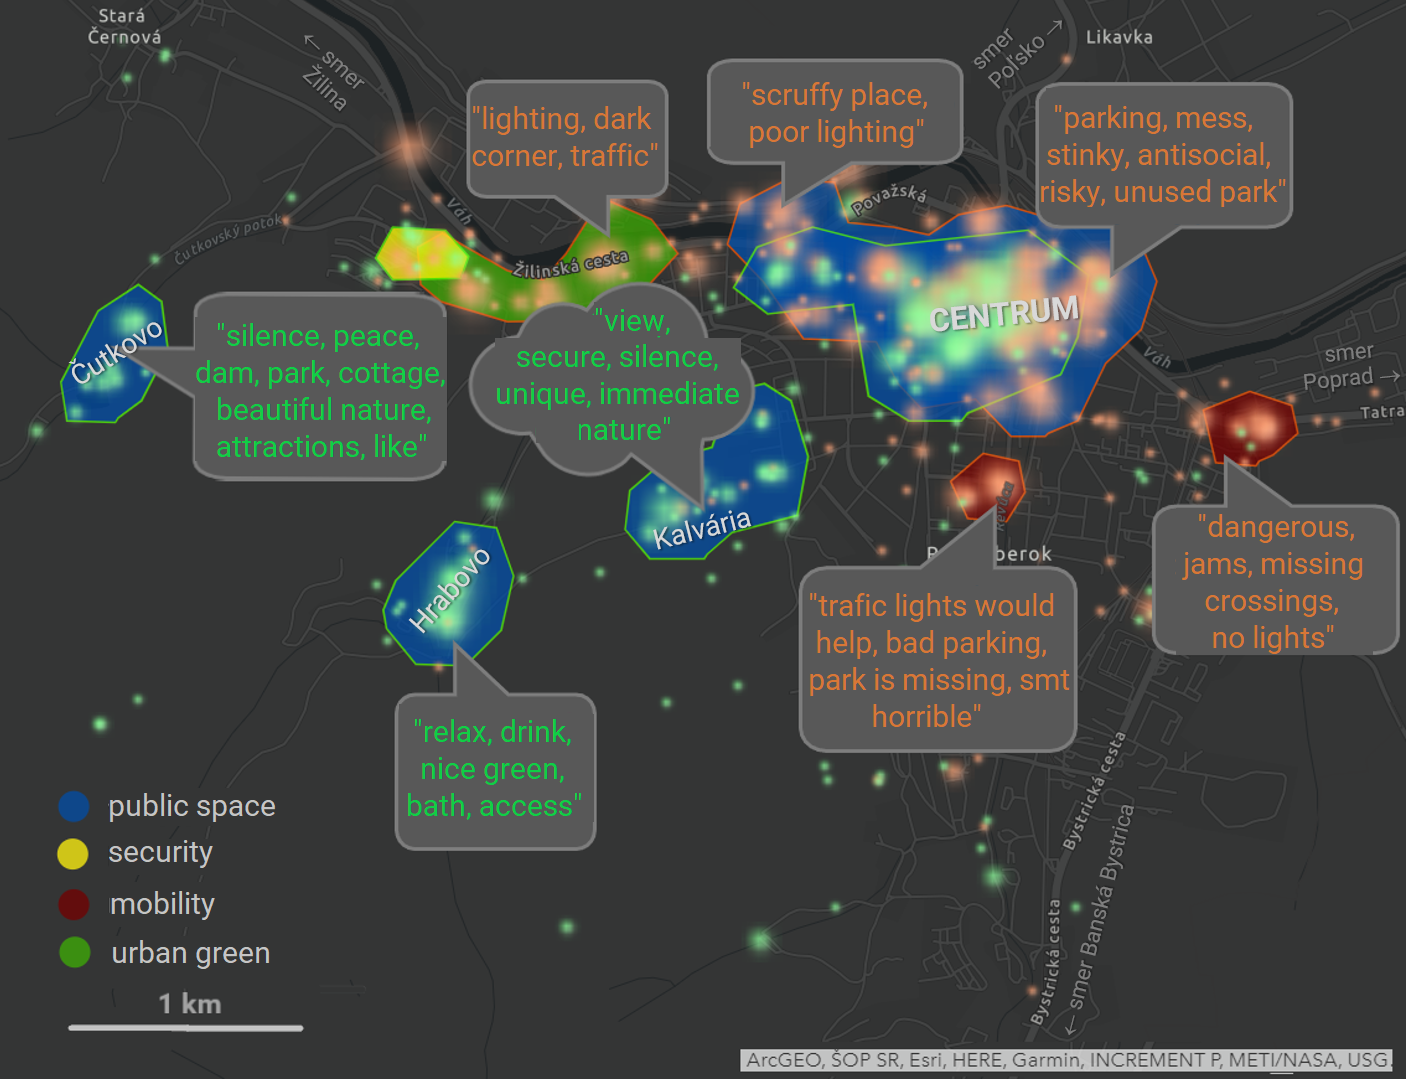
A aompilation of the respondent's comments, results translated to the real places, complex interpretation.