Dashboard of COVID-related Data in Northern England
The project aims to provide an interactive dashboard for targeting the booster vaccine. In particular, the content deals with the vulnerable regions based on demographic data, vaccination rates and covid-related metrics, for the purpose of decision-making about the booster vaccine.
The general approach will be to divide the work into vertical slices. Each work package related to implementation will result in an end-to-end tested delivered feature. See the work breakdown structure in the following figure.
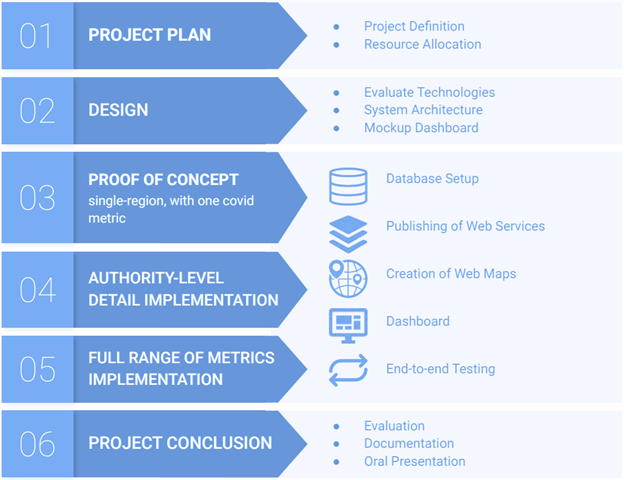
Objectives of the project are to provide automatically updated information about the current status with COVID-related topics that help make decisions about the booster (areas of vulnerability, vaccination rates over time,...). The outcomes are based on Free and Open-Source solutions (QGIS, PostGIS, GeoServer, MapBox, Apache Superset), OGC standards and promote the user-friendly intuitive interface. Sub-goals represent SDI Design, Proof of Concept, Implementation of Diverse Datasets to the Dashboard, Project Conclusion.
Dashboard Demo
Dashboard Content
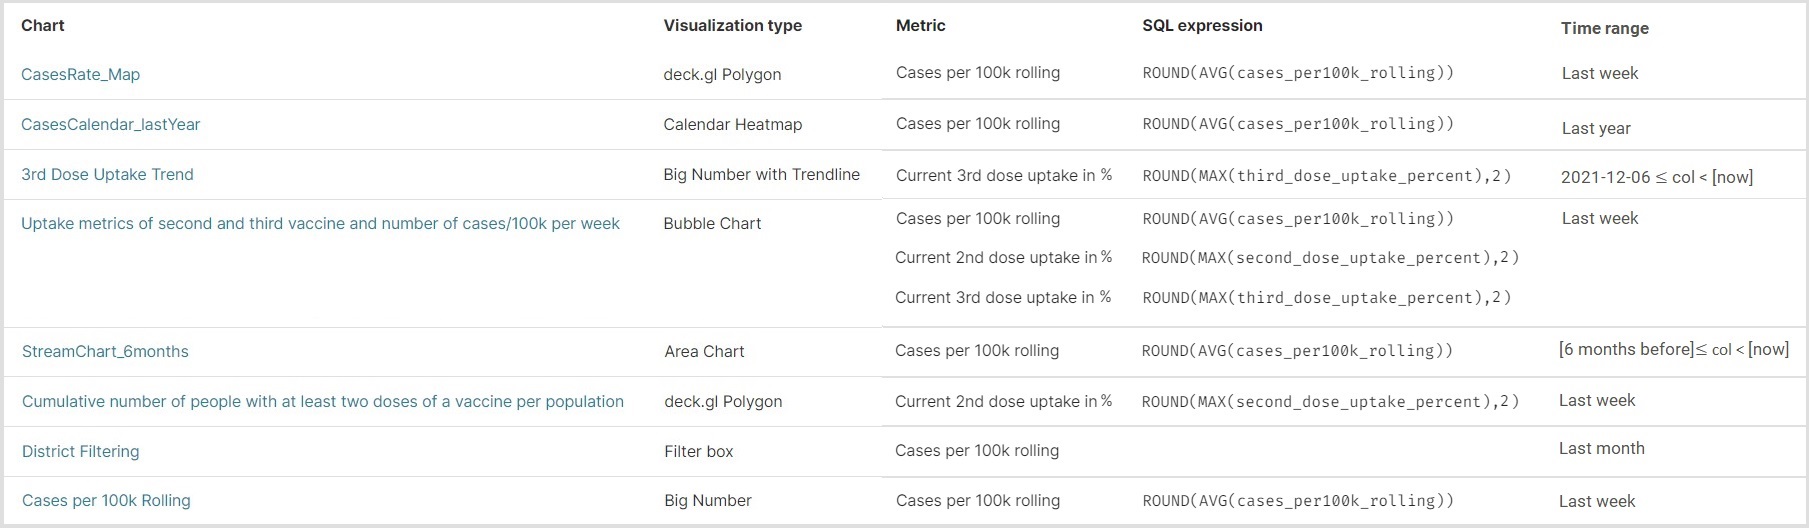
Charts
- Stream Chart
- Calendar Heatmap
- Big Number
- Bubble Chart
- Trendline with Big Number
Choropleth Maps
- Current Case Rate
- Complete Vaccination Rate
- Filter by Region
Documentation
- Web Feature Services
- Sources
- Database
- Documents
- Team Contacts