
EO Browser and Sen2Cube.at
The course Big Earth Data Conceprts was led by Dirk Tiede and Martin Sudmanns. The design of the course allowed me to dive into the recent developments towards the ideo of the Digital Earth. I had heard about some of them before the course started but here are the two I was inspired the most. EO Browser and Sent2Cube.at are state-of-art trends in the Earth observation.
EO Browser
The web application provides the “on-fly visualization” platform for Sentinel-2 imagery. Was founded by by Slovene Sinergise company and the is run on Amazon Web Services. The user may explore satellite data by filtering by location, date of acquisition and cloud cover for example.
The images may be visualized based on pre-set models (true colour, NDVI,…) or custom ones. Here the user may interactively mix bands as desired or furthermore, calculations (like thresholding, classification, math operations and many more) are executed through JavaScript. In Sentinel Hub GitHub page exists a library of such pred-customized scripts.
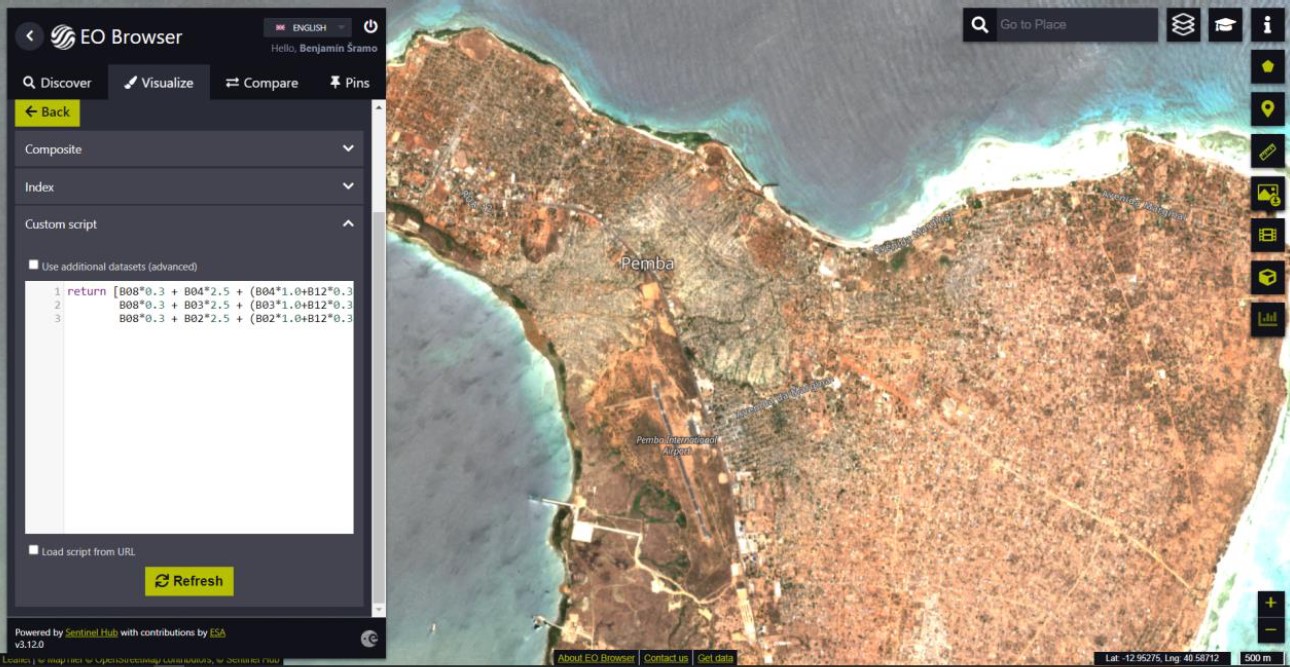 Cape of Pemba city in Cabo Delgado, Mozambique (Sentinel-2, Oct 2021). Visualization of urban structures enhances the built-up areas and the footprints of human activity. Script by L. Tolari
 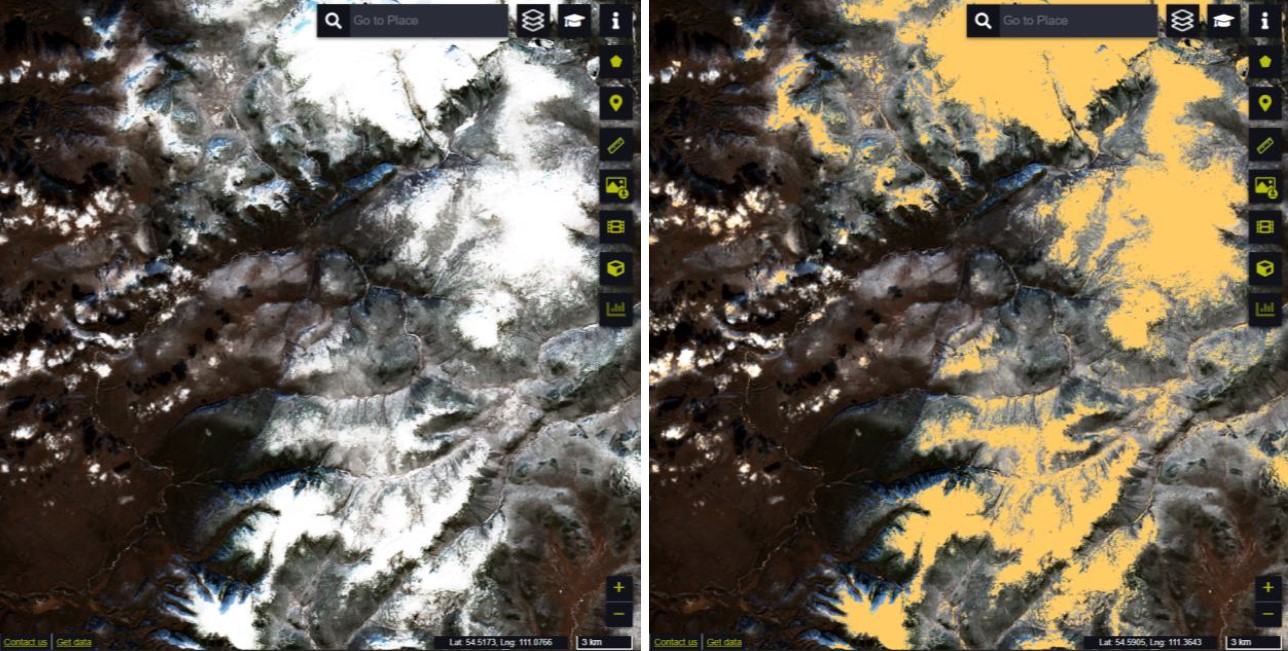 The snow detection works with NDSI and NDVI to differentiate the snow from the clouds and other land cover. Comparison before and after the masking, the east bank of Lake Bajkal (Sentinel-2, Oct 2021).
 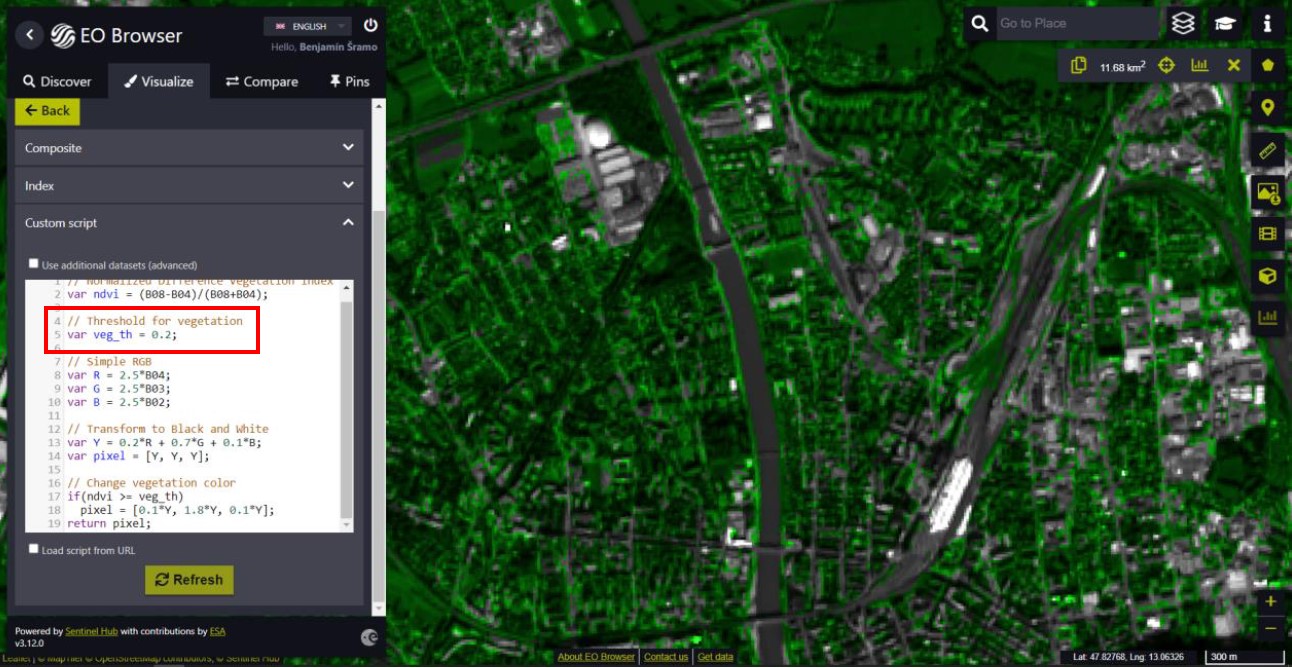 Urban green (NDVI > 0.2) in the north Salzburg (Sentinel-2, Sept 2021). The image is transformed to B&W except for the classified areas as “urban green”, where the green colour is highlighted. Script by Carlos Bentes.
 Sen2Cube.at
It is a semantic EO data cube allow web-based access to all Sentinel-2 images. In this case "semantic" means that the pixels are enriched by relatively low-level of the land cover. The enrichment is done automatically by SIAM calculations. SIAM’s 33 classes are utilised within the Sen2Cube.at system as the basis for semantic queries.
I was able to customize my own model for data extraction from the data cube. The main input data for the model is the greenness index. It is linearly related to LAI and is essentially a unique combination of a canopy chlorophyll absorption index, a canopy water absorption index, and a snow/water ratio index. It utilises 3 spectral bands (red, near infrared and mid-infrared).
The model consists of four results: two line graphs and two raster layers. The graphs provide the time series of mean greenness index and the mask percentage. Apart from the cloudiness for masking was included also the snow cover. Secondly, two output rasters reduce the values over the selected time frame using the pixel maxima and variance.
The maximum value reduction works better with relief overshadow bias of the northern slopes etc. Minimum and mean values are even more biased in such way. Although all three calculations are highly interrelated regarding the patterns. Therefore, the second calculation is different; it analyses the variability (variance) of the values throughout the timeframe. This metric has potential for detection of coniferous and deciduous trees, characteristics of agricultural fields etc.
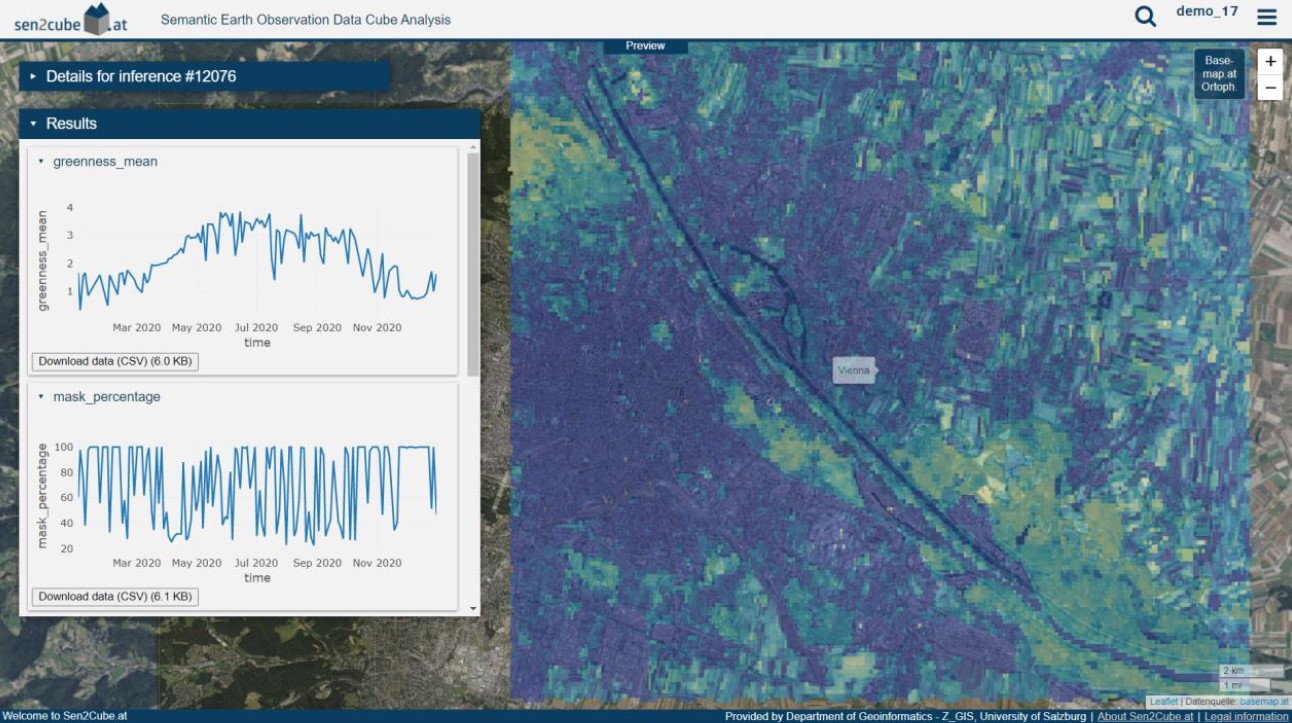 Northern Vienna, the Danube River, city parks, agricultural fields detection. Charts: greenness index and mask percentage evolvement over 2020. Image: the maximal greenness values in 2020.
 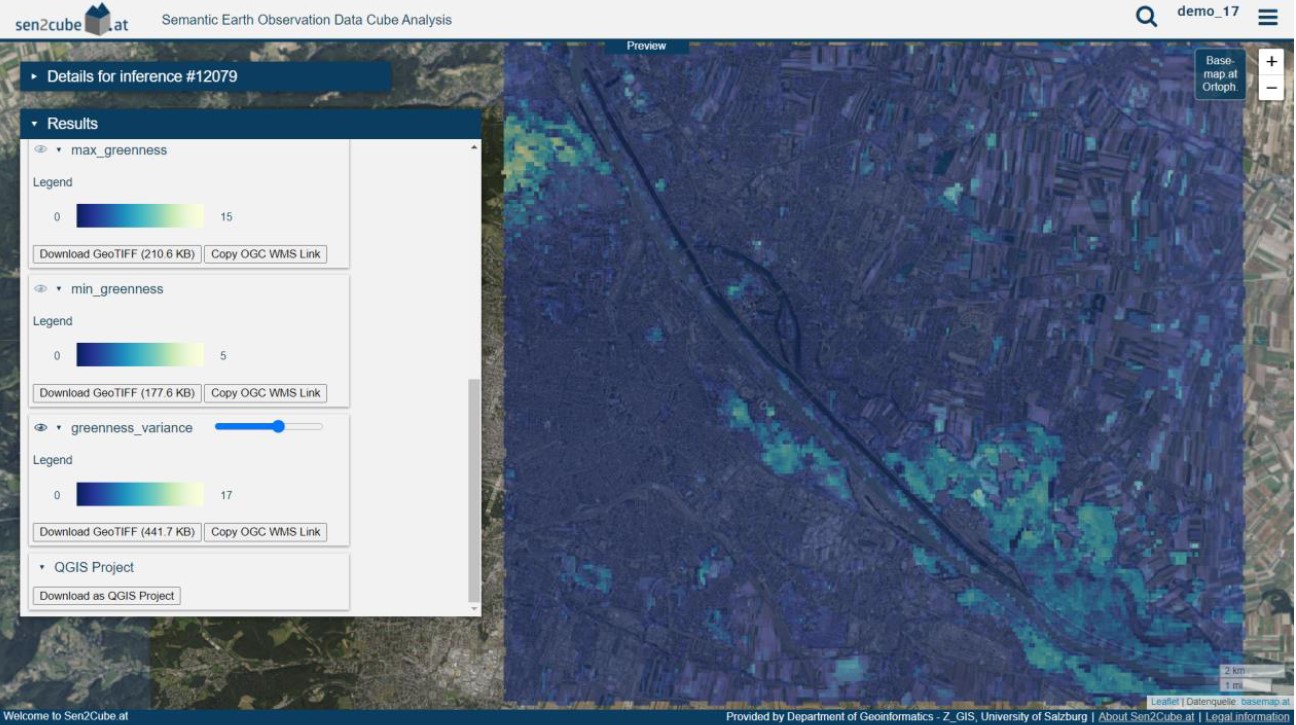 Northern Vienna, deciduous parks and forests detection. Image: the greenness index variance throughout the year 2020.
 The XML model for reproduction of the results is availabe on demand.